

One data source, one version of the result.
Reporting draws directly from the books. Management, accountants, and auditors all access the same data — without parallel spreadsheets and without ambiguity over which number is correct.
SERVICE · REPORTING
Capila Reporting — our own product for management reporting. Multi-entity P&L, balance sheet, cash flow, and detailed views — from a single source, refreshed daily.
Reporting draws directly from the books. Management, accountants, and auditors all access the same data — without parallel spreadsheets and without ambiguity over which number is correct.
The sync from accounting system runs daily. Whatever was posted yesterday appears in reporting this morning. You don't have to wait for the monthly close to see where the company stands.
From any total, you can drill down to the transaction and from there to the invoice itself. The numbers hold up under questions from auditors, banks, and investors.
Two, three, or five companies in the group — P&L, balance sheet, and cash flow are shown for each entity separately or for the whole group at once, in one click.
We use Capila Reporting internally and with our clients. 99.5% data freshness uptime over the last 12 months.
3 steps from data in the books to a report for the investor.
Every day, the data from accounting system lands in Capila Reporting. You and the accountant see the same thing — just in a different interface.
P&L across all entities, cash flow, receivables and payables overview, detailed breakdown. Drill down to the document.
Excel or direct read-only access.
No tool-switching, all in one place.
Capila Reporting pulls data directly from your accounting system by default. Connectors to other data sources are available on request.
A demo with sample data opens in one click.
01 / 05
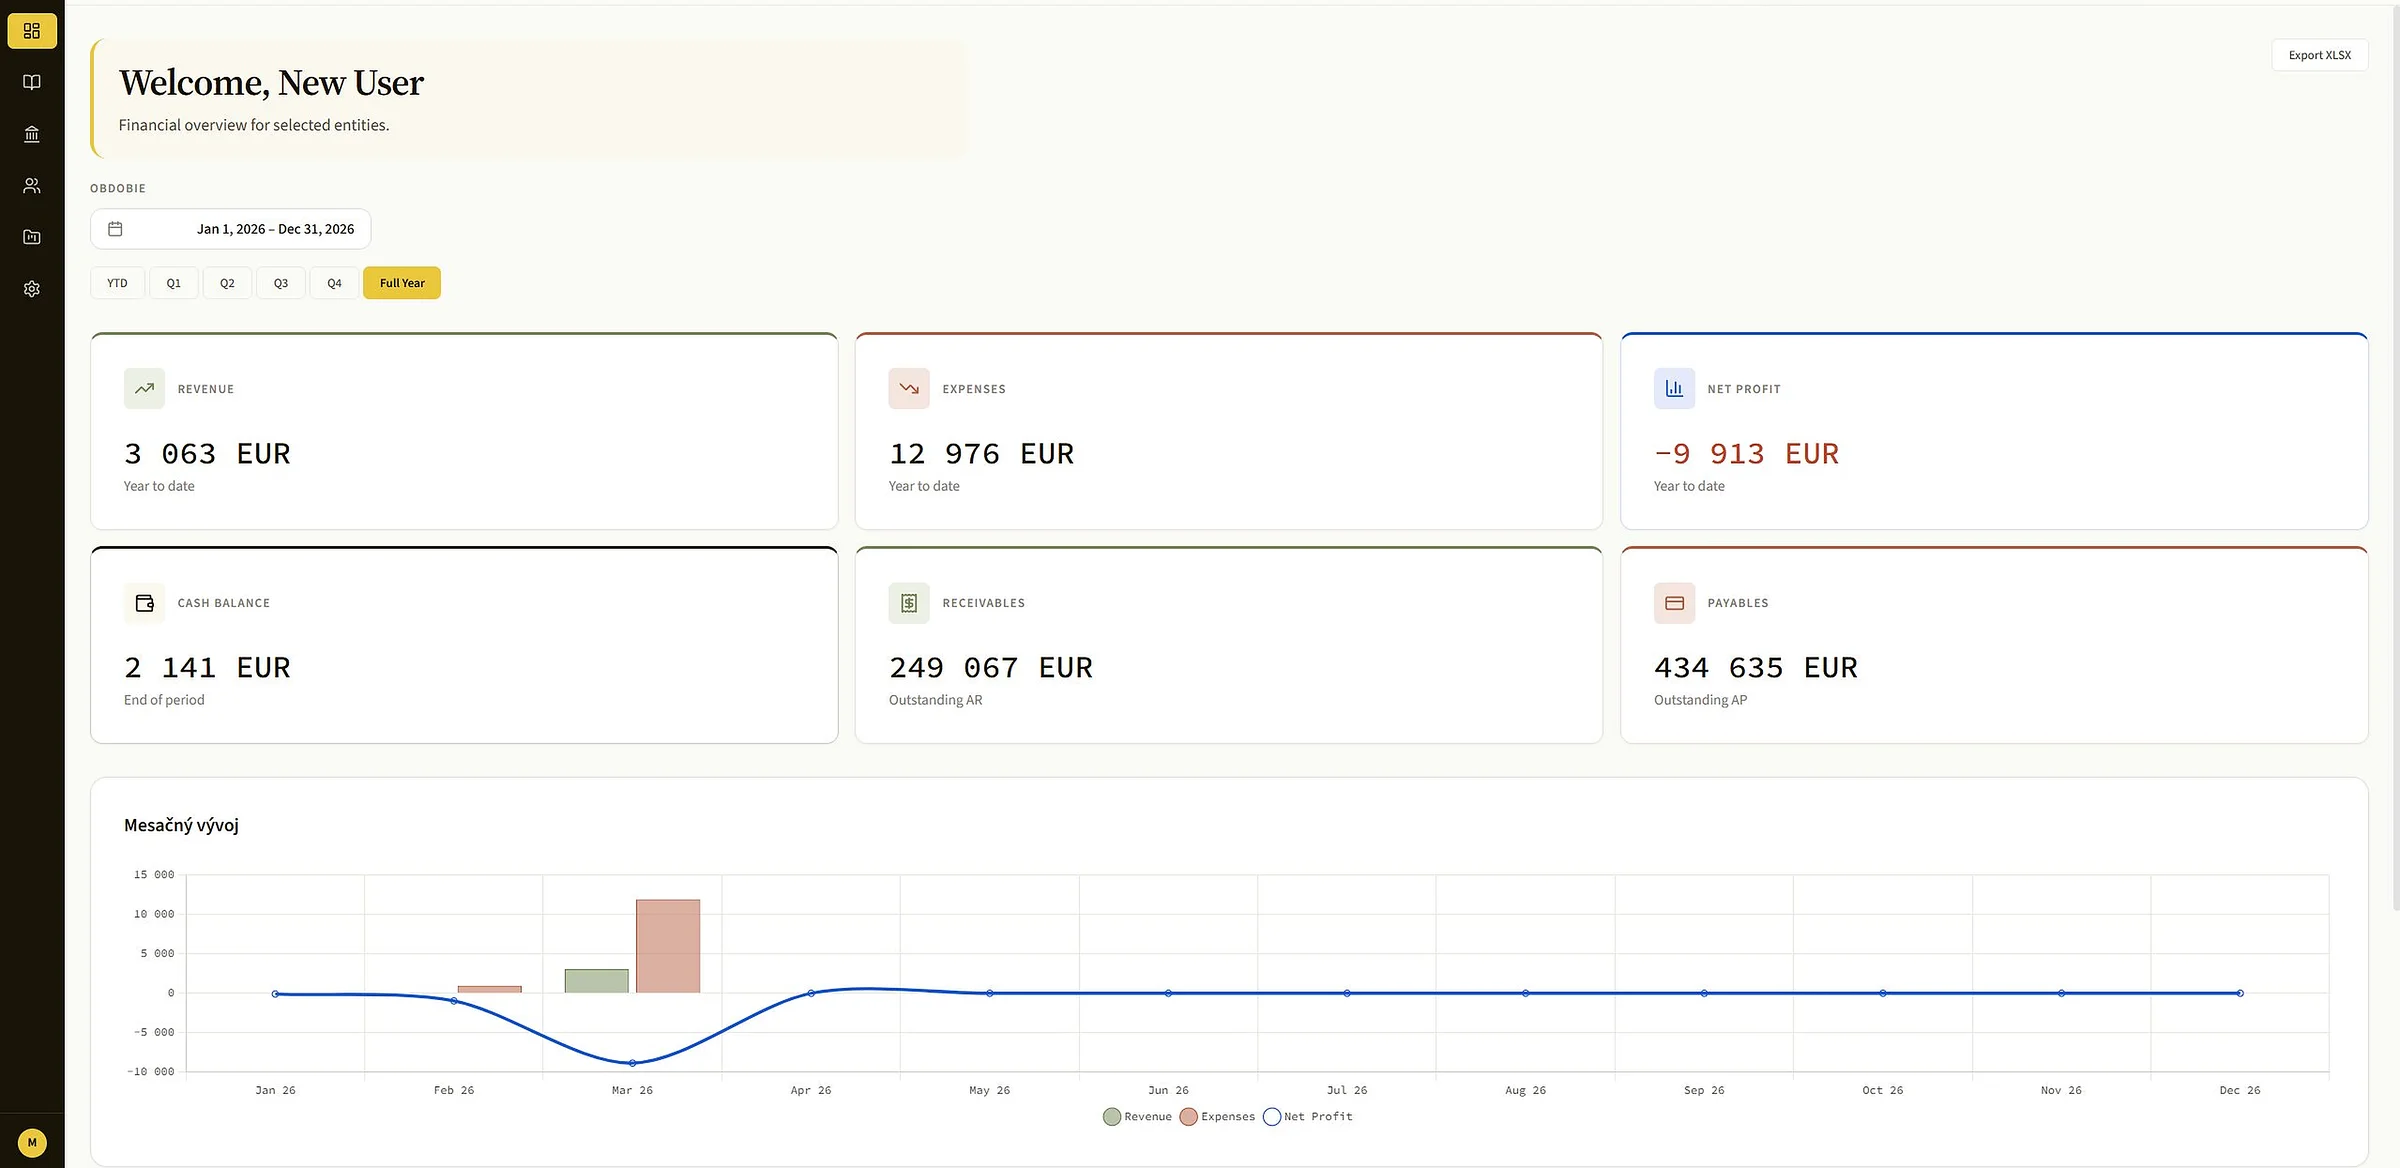
Revenue, expenses, cash, and open AR/AP for the selected period. One view to steer the month.
02 / 05
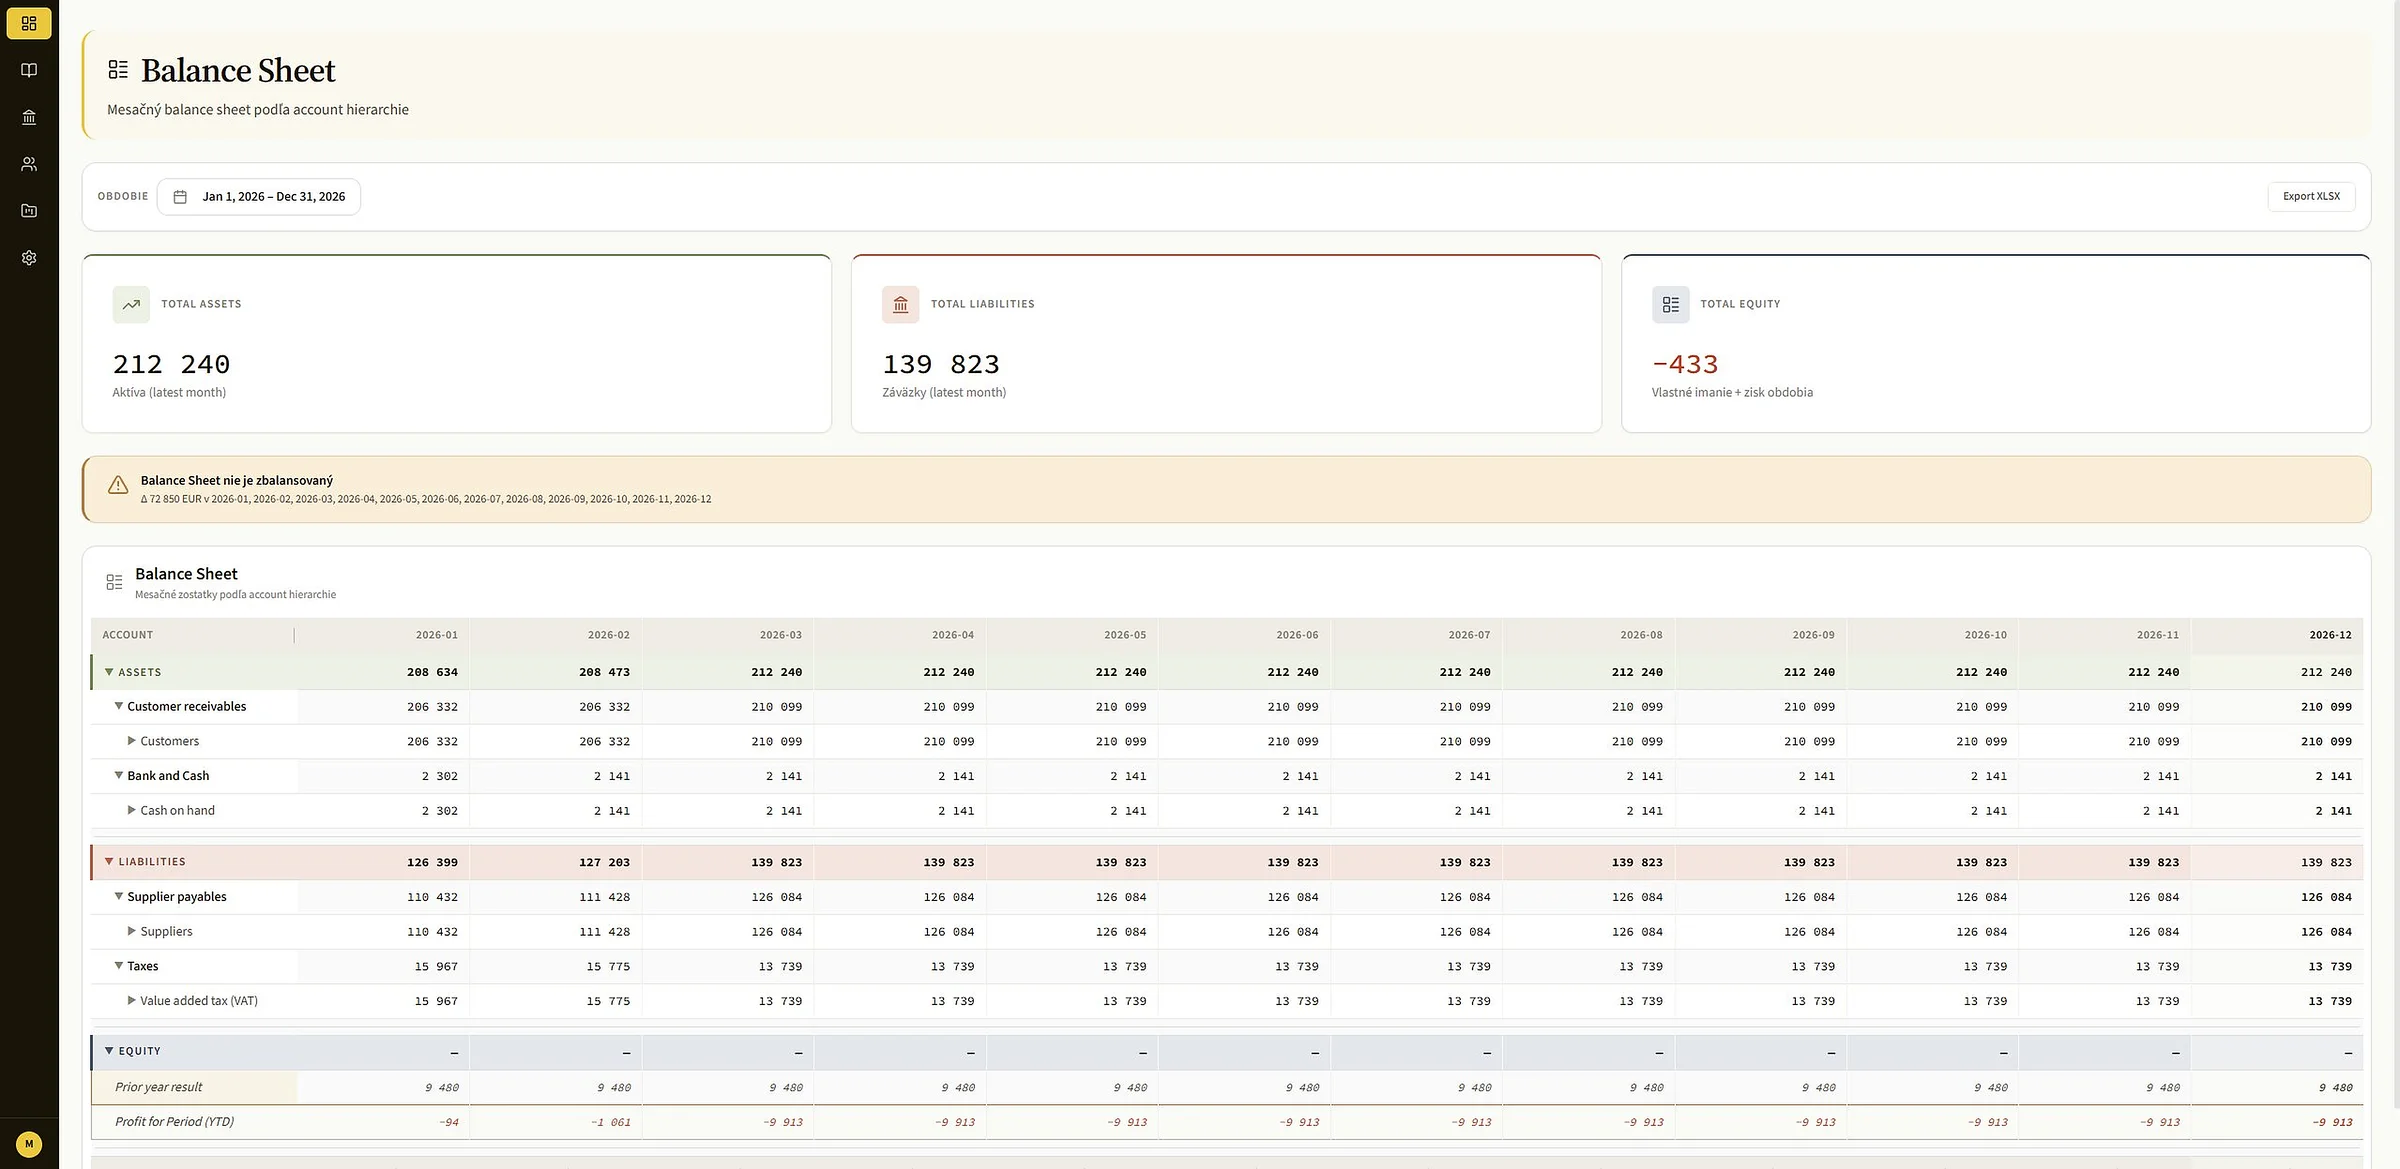
Assets, liabilities and equity refreshed daily. Monthly breakdown with an alert when the balance sheet does not tie out.
03 / 05
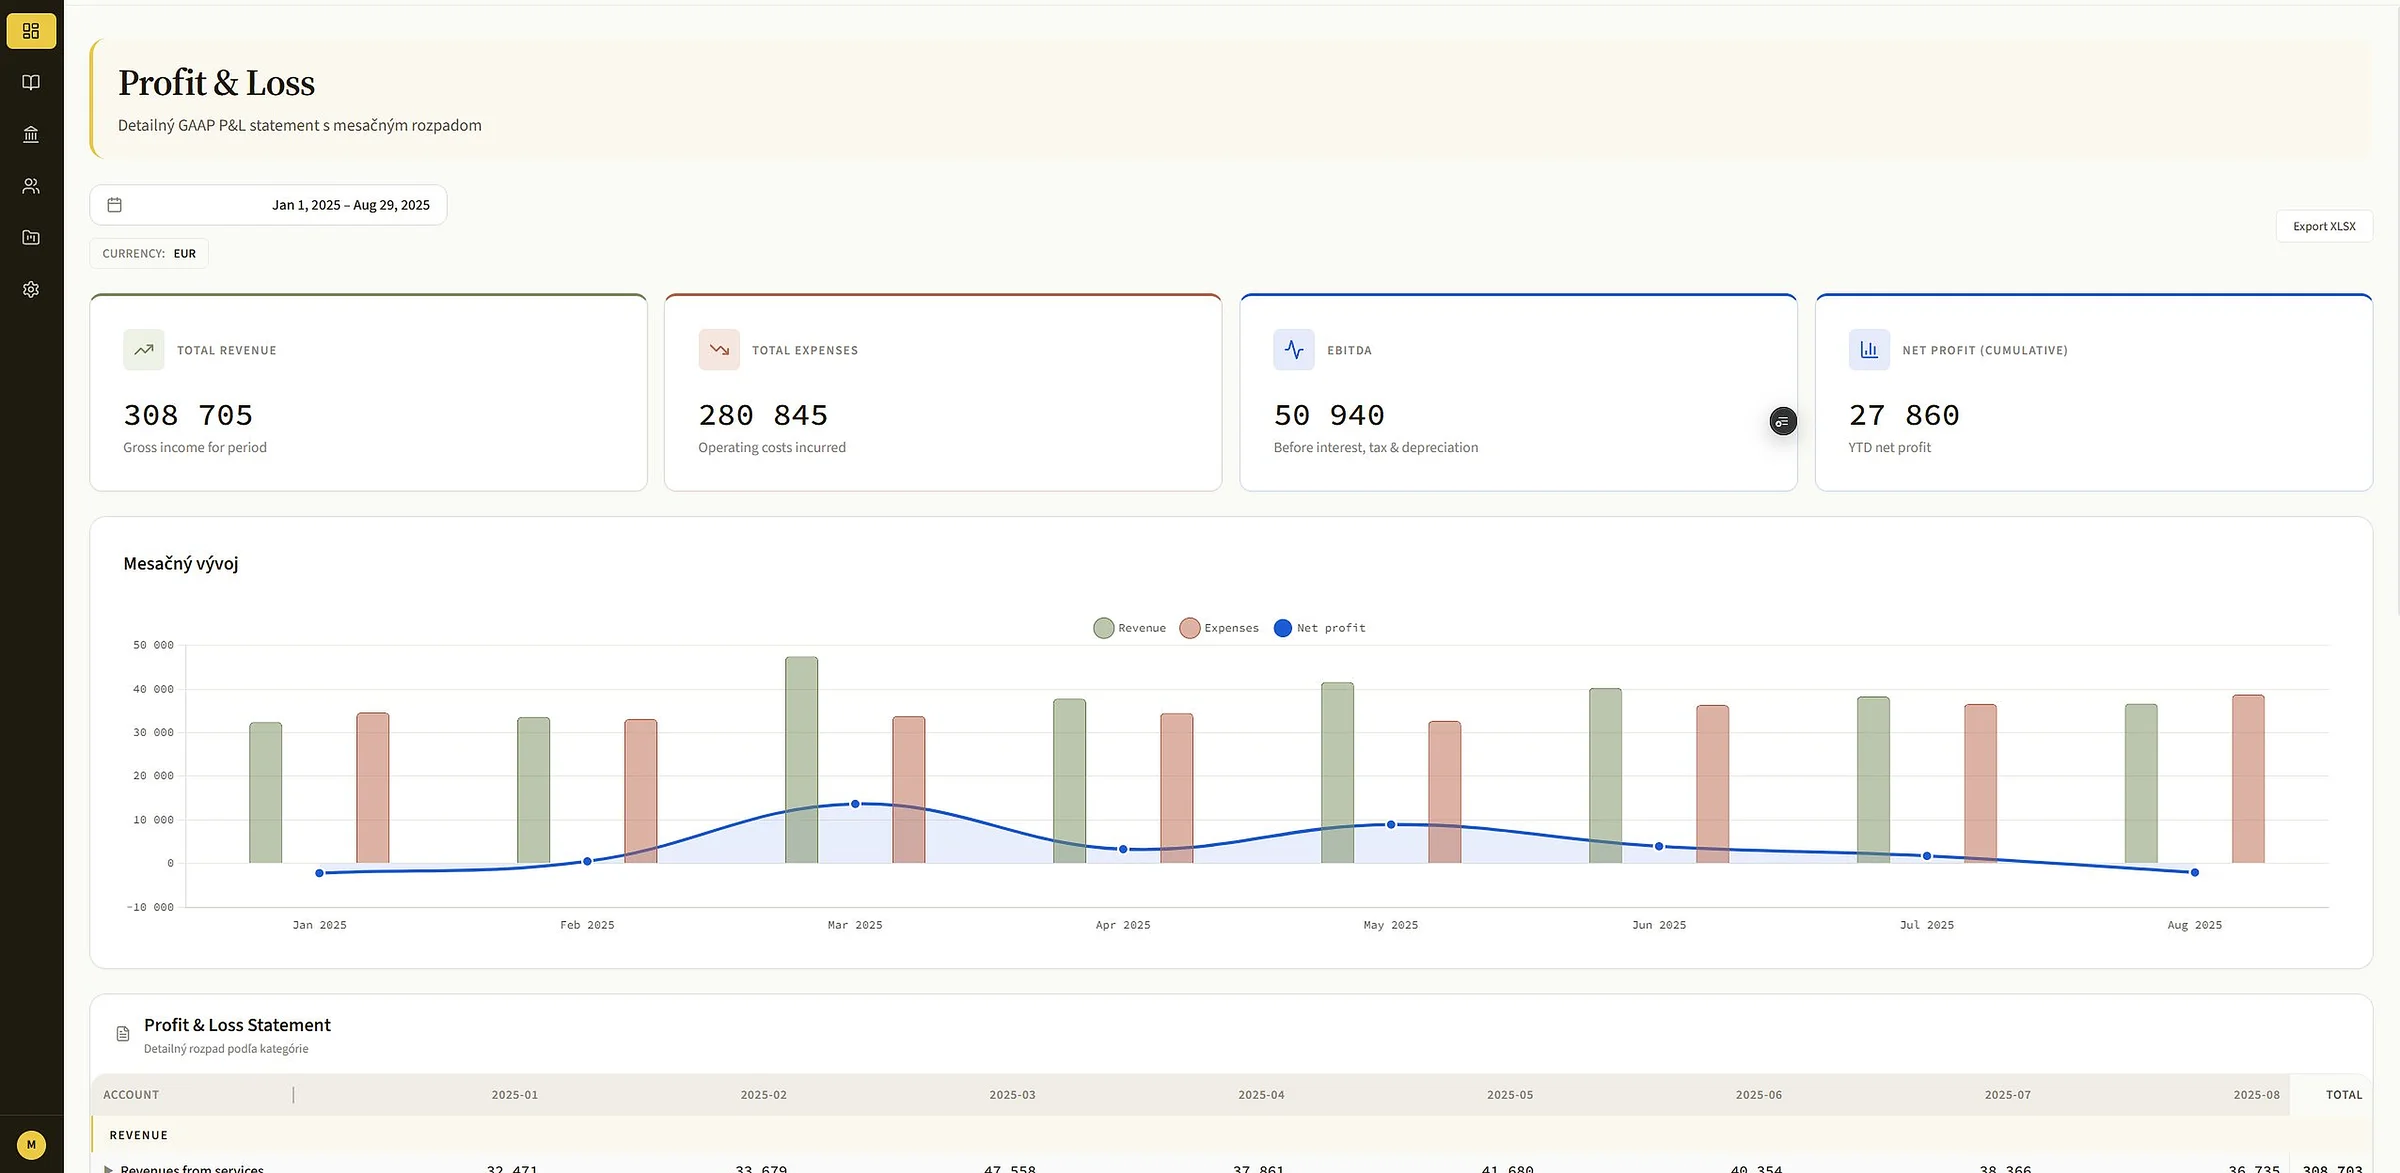
Detailed GAAP profit and loss with a monthly breakdown, EBITDA and cumulative net result for the period.
04 / 05
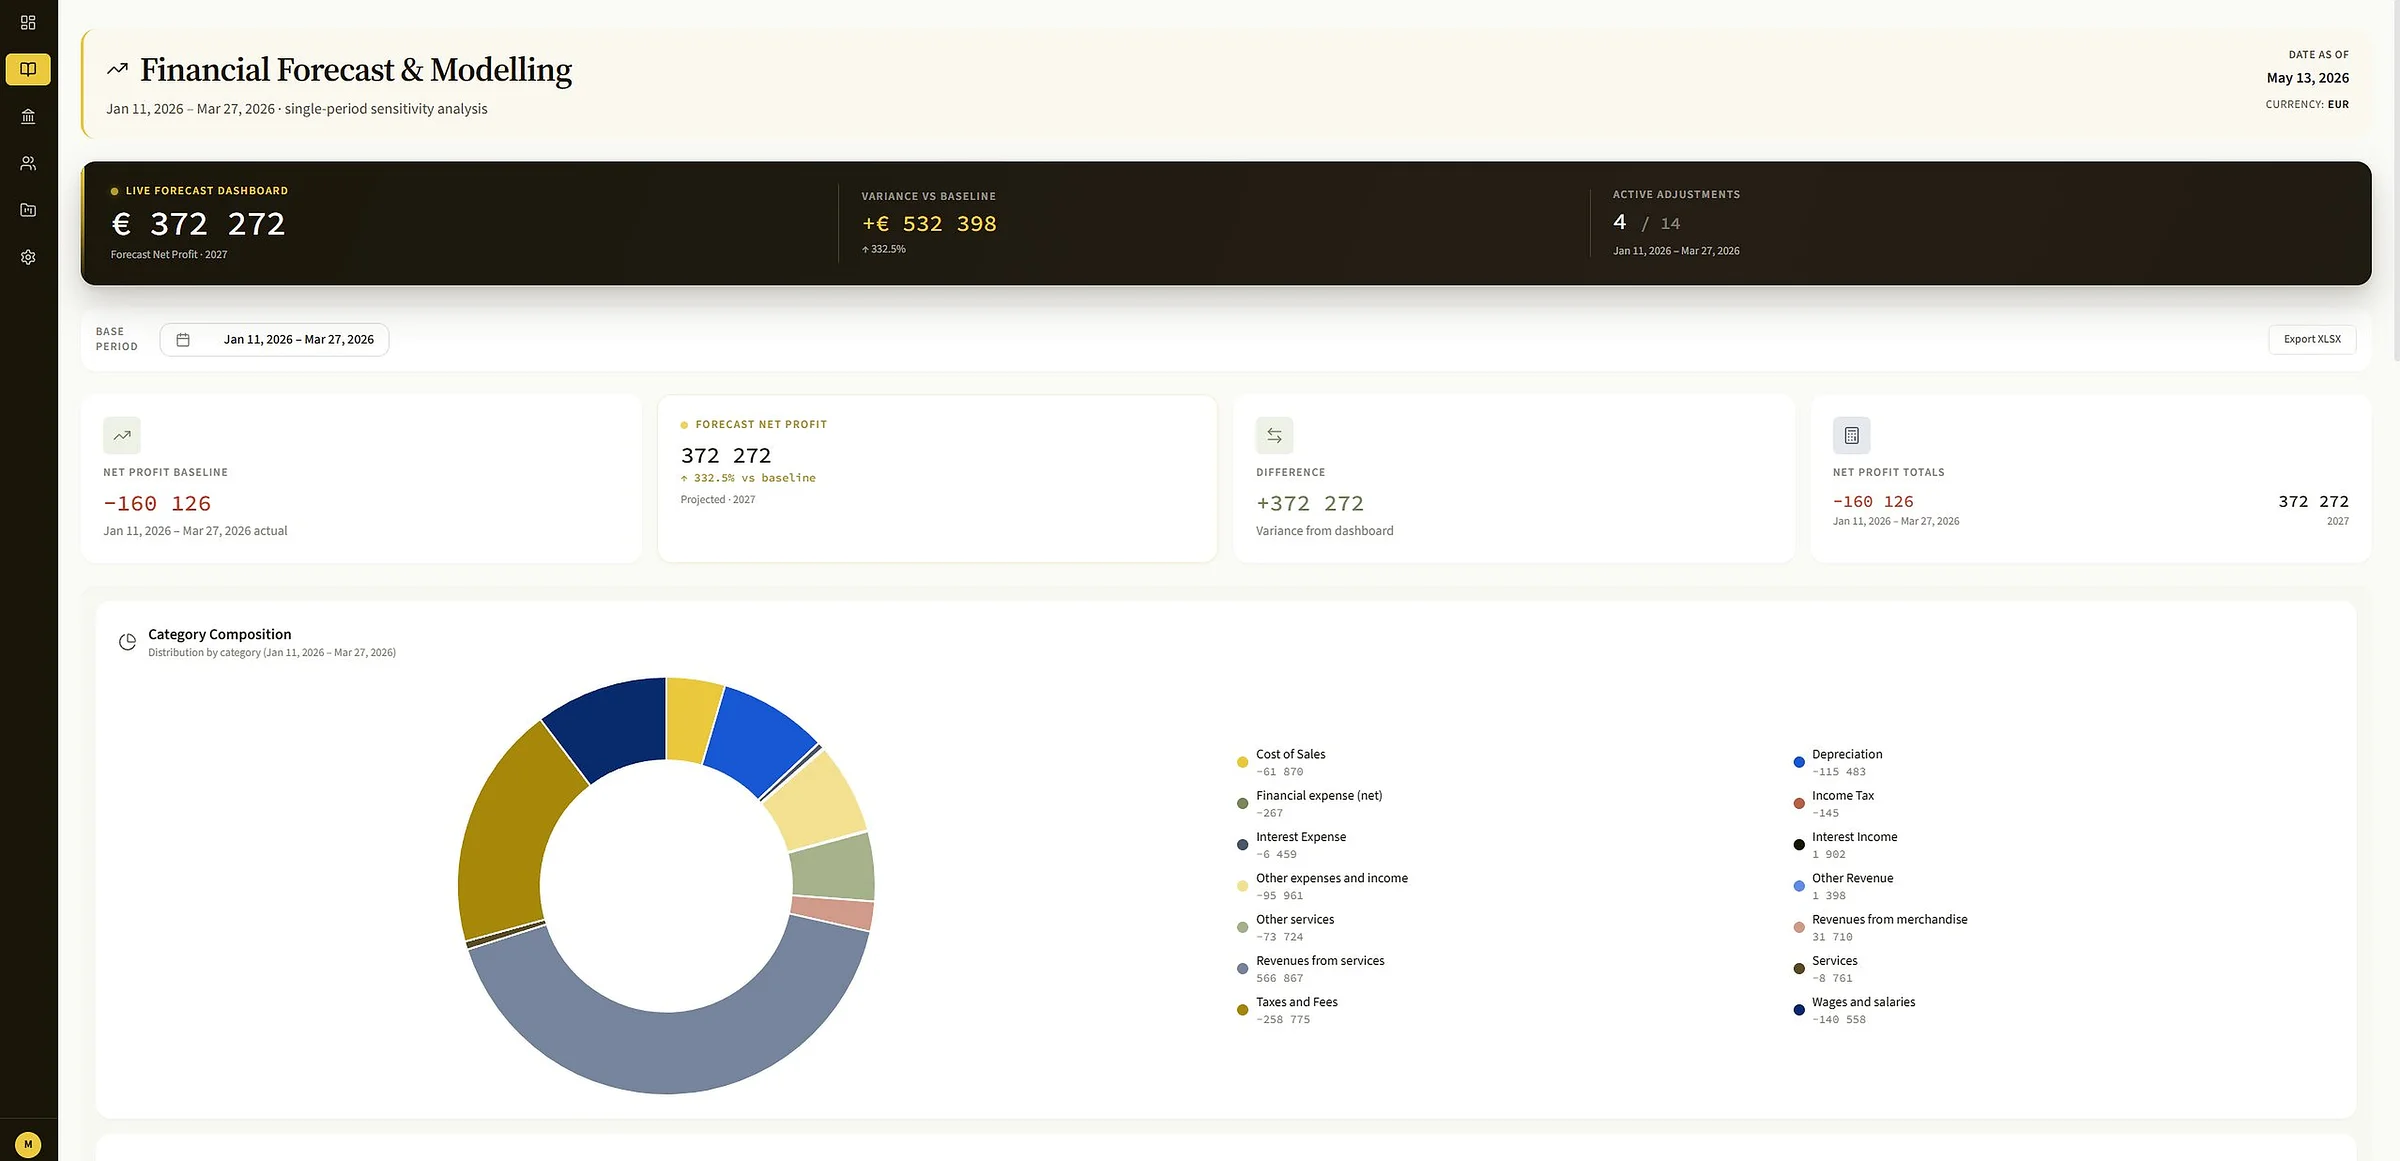
Sensitivity analysis on top of the baseline. See the impact of adjustments on net profit, variance by category, and an Excel export.
05 / 05
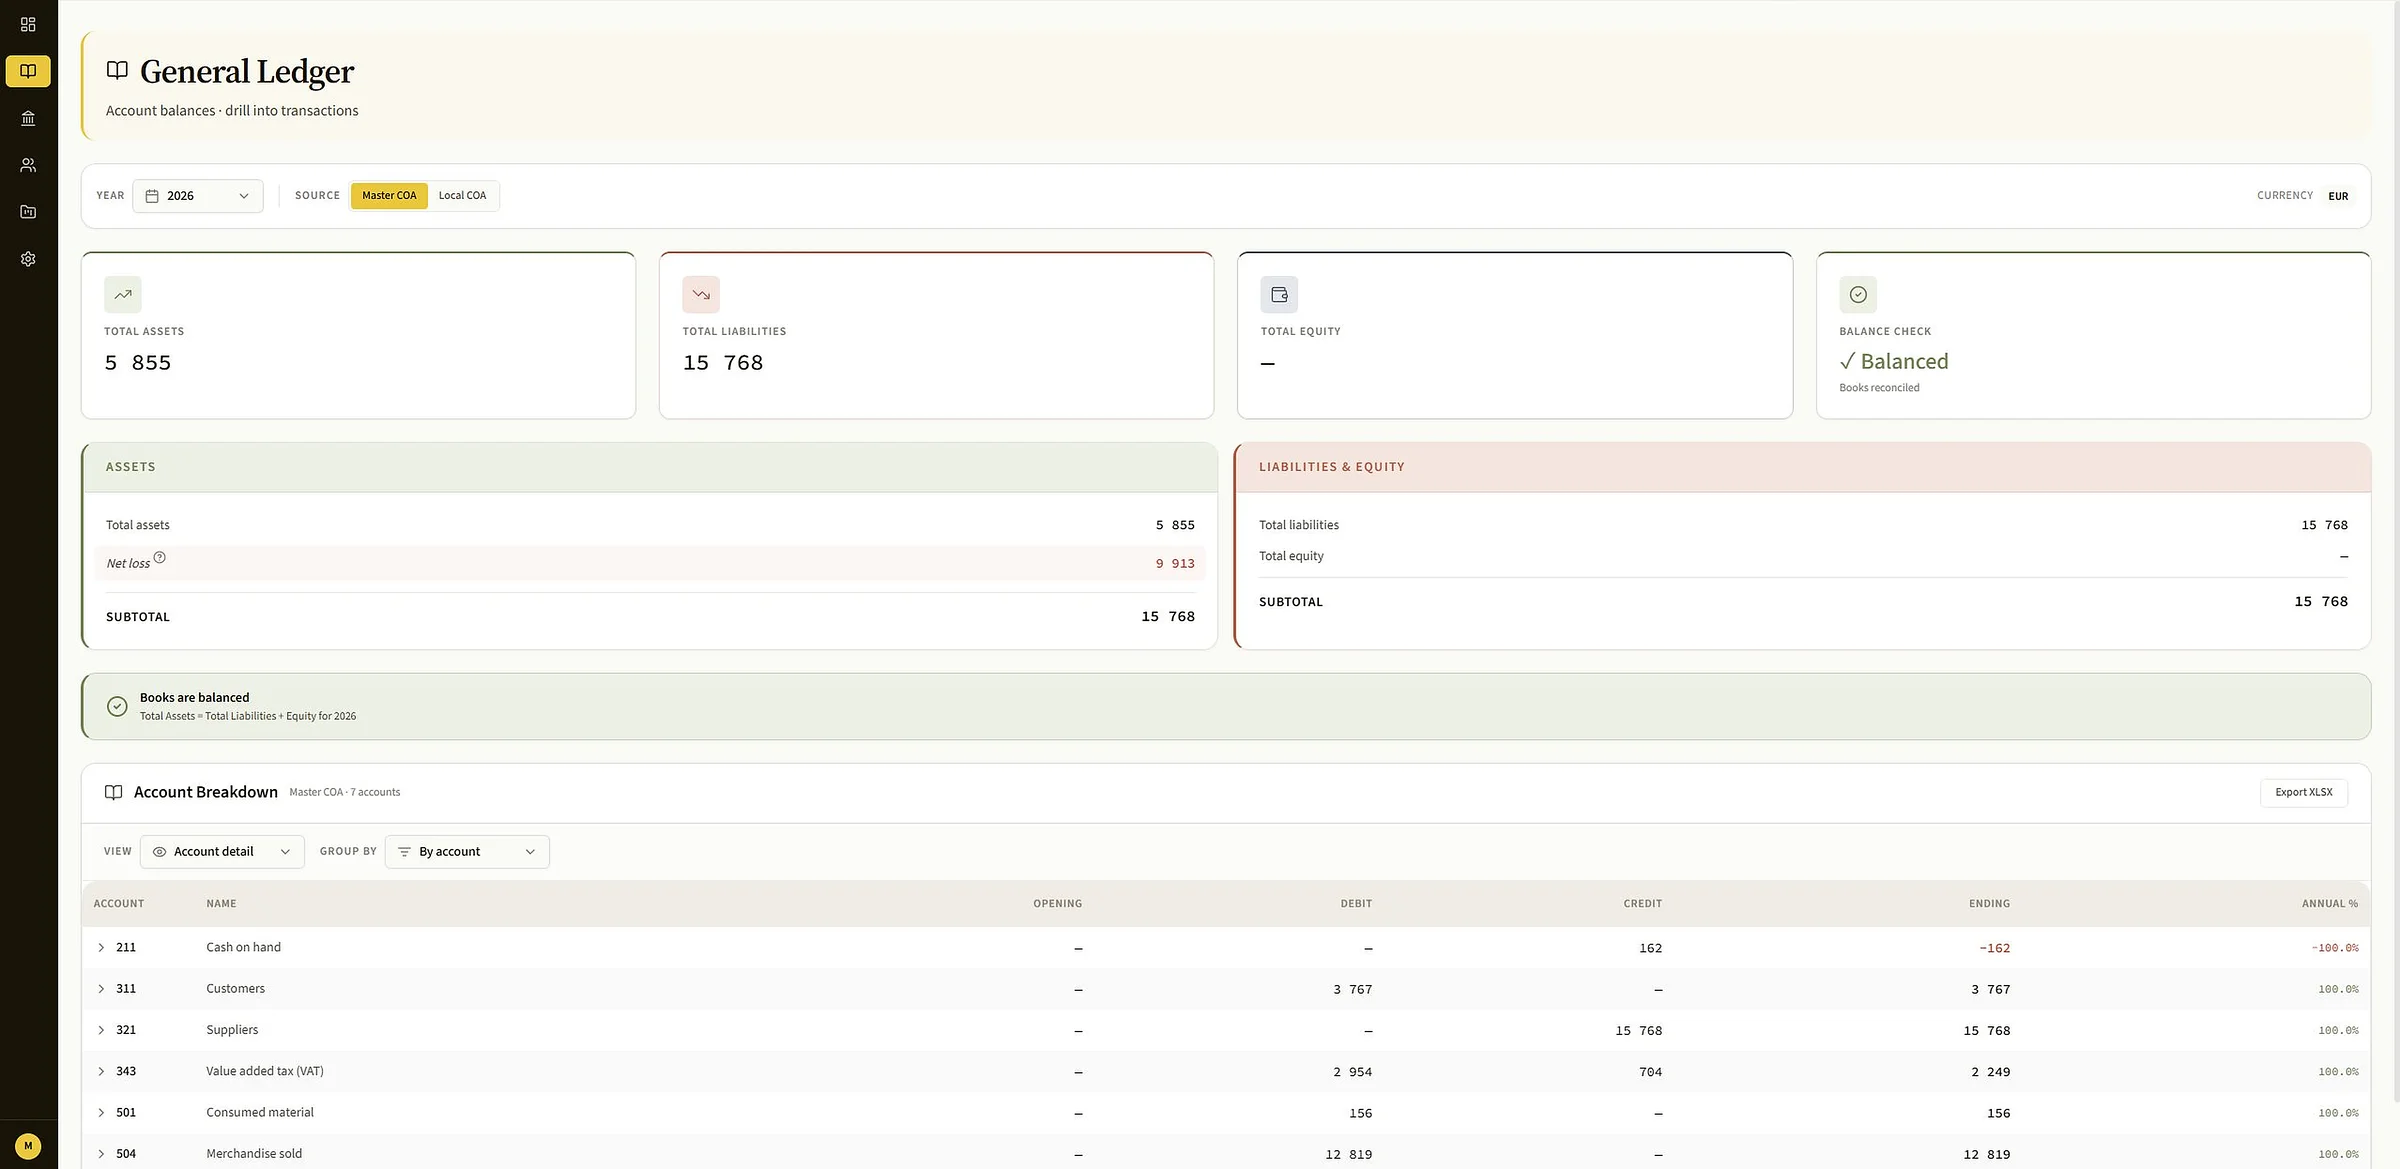
Balance check, account overview and drill-down to the individual document. Master COA and local charts of accounts.
01 / 05
Revenue, expenses, cash, and open AR/AP for the selected period. One view to steer the month.
02 / 05
Assets, liabilities and equity refreshed daily. Monthly breakdown with an alert when the balance sheet does not tie out.
03 / 05
Detailed GAAP profit and loss with a monthly breakdown, EBITDA and cumulative net result for the period.
04 / 05
Sensitivity analysis on top of the baseline. See the impact of adjustments on net profit, variance by category, and an Excel export.
05 / 05
Balance check, account overview and drill-down to the individual document. Master COA and local charts of accounts.
Capila Reporting works with Pohoda by default. For other accounting systems or external data sources, we build custom connectors on request.
Get a monthly estimate for your company in 30 seconds.
“We used to build the management view in spreadsheets — it worked, but it took time, and our numbers occasionally drifted slightly from what was in the books. Capila built us a reporting straight from the accounting data, and over time more views and tools we use at Labyrinth Labs were added to it. These days I open the reporting in the morning and see where the company stands — without anyone on the team spending hours in spreadsheets. And when I have a question, I message the accountants on Slack and we deal with it the same day. For a company that's growing, this is a different league entirely.”